
The recently announced THE Asia University Rankings 2026 indicates a degree of stability at the top of their table. However, to understand the long-term trajectory of these institutions, it is necessary to examine the underlying structural drivers and bibliometric indicators that precede ranking shifts.
While global rankings are primarily influenced by research volume, citations and reputational measures, these are trailing indicators. By analyzing the fundamental inputs and capacity of national research ecosystems, we can identify potential future institutional performance.
INPUTS:
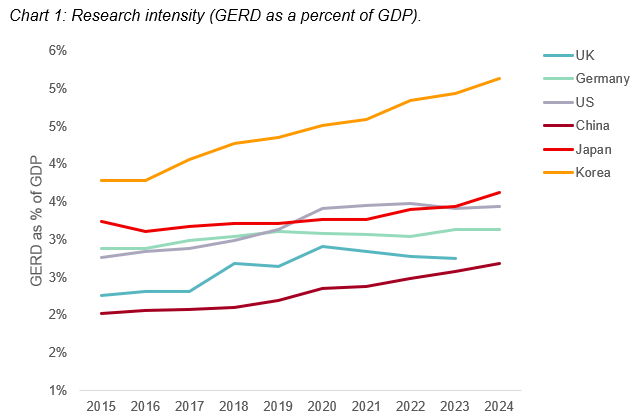
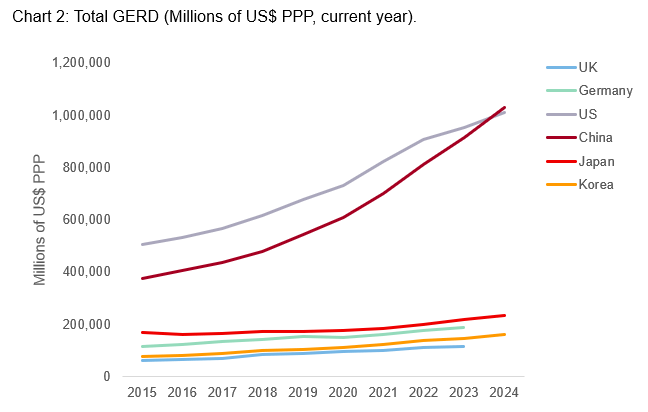
This analysis utilizes Gross Domestic Expenditure on R&D (GERD) as an indicator of research intensity (Chart 1) and volume (Chart 2). GERD is a composite metric reflecting the total expenditure across universities, research institutes, government labs, and corporations. It is therefore a proxy for the entire national research enterprise. To ensure cross-border comparability, financial data is converted using Purchasing Power Parity (PPP) which accounts for differences in the cost-of-living in specific economies.
Many major economies across the world are increasing the proportion of GDP that goes towards R&D but, as can be seen in the below chart, the pace of increase in Asian economies is higher than many developed nations. As for the volume for R&D expenditure, the US and China dominate total spending and China has surpassed the US in recent years (note that the PPP conversion is significant and China still lags the US when using straight exchange rate conversion). Recent political and policy changes in the US may lead to a dip for 2025 onwards. Potential decline in the global economy may also have an impact everywhere, especially for corporate R&D.
In recent years, increased corporate spending on R&D is a major contributing factor. For many Asian nations the closer integration between government, universities and industry generates a significant flow of corporate research funding to universities. This integration between industry and universities is reflected in the rankings. If one looks at THE’s World University Rankings there are many universities from China, Japan and Korea with exceptionally high scores in the “Industry” pillar.
Note that the data source for charts 1-3 is OECD and although China is not an OECD member it does supply data, India however does not and is not included in this part of the analysis.
Notes1
CAPACITY:
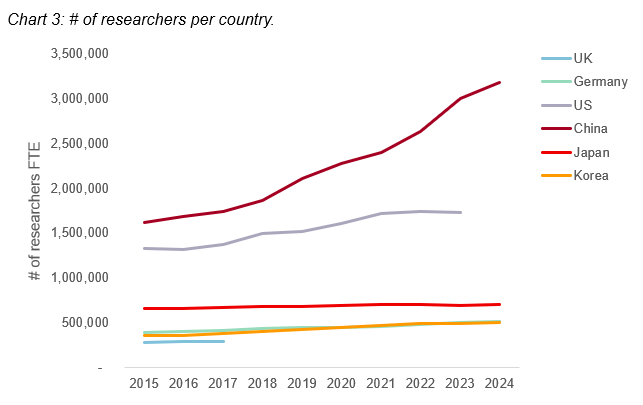
Research capacity is fundamentally driven by human capital (automated research using AI / robotics may become significant in the future). Similar to GERD the total number of researchers includes staff from all sectors and is an indication of a nation’s total R&D capacity.
China’s research capacity is currently characterized by rapid expansion. This growth is reflective of population scale, a strategic policy to fund the knowledge economy through government support of basic and applied sciences, and corporate investment as the Chinese economy moves from low-cost manufacturing toward R&D-intensive sectors, such as advanced electronics and automotive engineering.
The capacity of human capital is a potential limiting factor in the growth of academic R&D and Chinese investment in higher education in recent decades has significantly increase the proportion of the population with advanced degrees. This is a very significant as it takes years for an individual to progress from bachelors degrees, doctoral degrees, post-doctoral appointments to become junior faculty.
However, China, Japan and Korea all have aging populations creating a potential decline in the pipeline of developing human capital in academia. Academic careers are measured in decades and most faculty members are relatively immobile (the exception being early career researchers who are highly mobile) so I don’t think there is a concern in the short term.
Furthermore, academic recruitment is global and a university’s ability to attract talent can be influenced by many factors. At PRAXIMA: Analytics and Impact I am very interested in exploring an evidence based approach to faculty recruitment, please get in touch if you want to know more.
OUTPUT AND IMPACT:
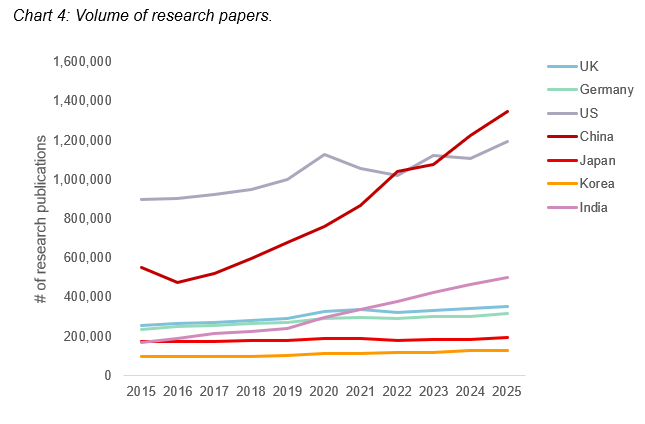
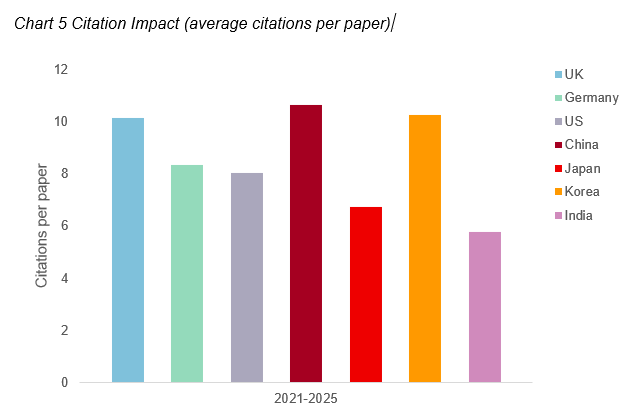
An analysis of research outputs (scholarly articles) and citation impact (citations per papers) reveals a shift in Asian research. Between 2016 and 2025, China’s annual research output more than doubled, and now surpasses that of the United States. India saw similar growth over the same period, but the total volume is less than half of China’s.
Other nations experienced a modest increase of approximately 30% but Japan’s growth was lower. Despite this rapid scaling of volume, China has successfully maintained its citations per paper relative to global peers, suggesting that research quality has not been sacrificed for quantity. India and Japan are lagging other countries for citation impact, suggesting room for improvement.
Notes2
STRUCTURAL ARTIFACTS:
National research ecosystems are structured diversely. For instance, in the US and UK universities conduct most of the research, but in Germany and China national academies such as the Max Planck Institutes or the Chinese Academy of Sciences perform a large proportion of national research and hence less research is conducted by universities. There are also differences in the concentration of research to elite research intensive universities vs a broader approach where the research funding is spread across a broader range of institutions.
While a robust national research enterprise does not necessarily translate immediately to university ranking gains, universities remain the central nodes of these ecosystems. Even when research is conducted at a government lab or a corporation, universities will be important contributors in developing research talent and in conducting collaborative research.
Additionally, different countries will have different research objectives, some countries will be focused on physical and applied sciences so support the economic development of manufacturing, others will be strong in the life sciences, social sciences or the humanities. For each of these broad fields the characteristics of research funding, publications and citations will be quite different and should be taken into account when doing a more robust analysis. The OECD data used in this analysis is rich and enables unpacking (with limitations) of some of the structural artifacts discussed here. Similarly bibliometrics (the analysis of publications and citations) uses well established techniques to better understand trends and biases. This analysis intentionally looks at the broad landscape to better understand national trajectories rather than a detailed view. If you are interested in finding out more please get in touch.
TRENDS:
Given the positive trajectories across all primary indicators (input, capacity, output, and impact) I anticipate a continued shift in global rankings for the foreseeable future. The data suggests that Asian universities, particularly those in China, will continue their ascent as they leverage their national research enterprises. India is also ascending but lagging China by a decade or so. Because the rankings rely on trailing indicators it is likely that the increase focus on R&D in India will start to impact the rankings in the coming decade. It will be interesting to see how domestic policies can shift the needle. Will western nations re-invest in R&D? will Indian universities transition to take leadership in the rankings in the same way that Chinese ones have? How will Transnational Education (TNE) impact the rankings? (what is the impact of branch campuses), Will the big rankings publishers change their methodologies to reflect the changing landscape?
What are your thoughts? let us know in the comments below.
Notes:
- Data from OECD, Main Science and Technology Indicators (MSTI) see https://data-explorer.oecd.org/. There are some datapoints missing for certain years, and India does not contribute data to OECD. ↩︎
- Date from OpenAlex (https://openalex.org/) limited to articles, reviews, books and book chapters. ↩︎

Leave a comment